Every year during the NBA off-season, analysts debate how good or bad the players in that year’s draft will be. Every year we get cautioned that you really can’t evaluate a draft until 3 years later. However, aside from the occasional post about redrafting, I don’t see too many posts evaluating drafts multiple years later. Even for redrafts, the focus is on ‘what ifs’, which are interesting (and painful, I’m a Kings fan and we took Thomas Robinson and Jimmer Fredette instead of Kawhi Leonard and Damian Lillard, yikes), but don’t necessarily evaluate the draft as a whole.
For this post, I want to look back at previous drafts and see how productive they have been over their lifetime and answer the questions
- 1a) Are there good and bad draft classes?
- 1b)How far are they separated in terms of win shares produced.
- 2) How many seasons does it take to evaluate a draft class
To do this, I use data from basketball-reference.com and use cohort analysis to examine the win shares produced in each season by each draft class over the past 15 years. Results are plotted below.
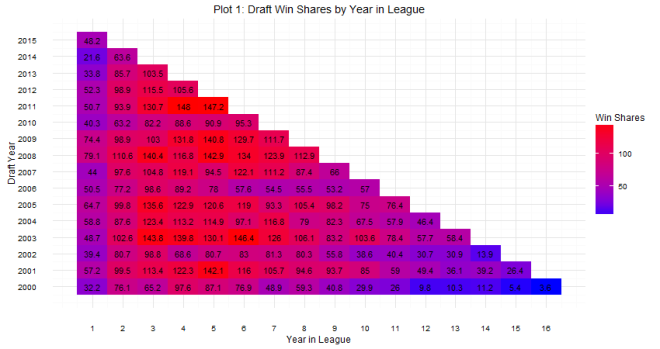
Plots 1 answers question 1a. Drafts 2003, 2008, 2009, and 2011 visually stand out as providing more win shares than others. Drafts 2000, 2002, 2006, and 2010 stand out as poor drafts. Plot 2 looks at the same information in line graph form. As both plots show, there are definite tiers between good drafts and bad drafts, addressing question 1b. Honestly, I was take aback by how big the differences in terms of win shares are. For example, the 2011 draft class produced 148 win shares their 4th year in the league (the most produced by a draft class in a single season). In contrast, the 2002 draft class only produced 68 win shares their 4th year in the league, less than half the win shares of the 2011 draft. Similarly, the 2010 draft only produced about 60% of the win shares of the 2011 draft. A less extreme comparison (Drafts 2000 and 2009) shows that the poorer draft was only 75% as productive as the better draft in year 4. In sum, there definitely are good drafts and bad drafts, and the difference is rather large: a bad draft can literally be half as productive as a good draft in extreme cases and less than 75% as productive typically. 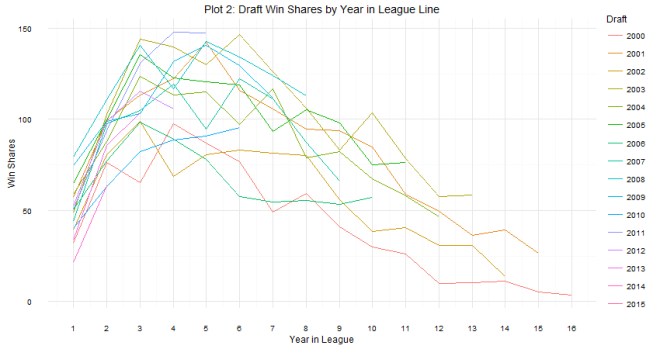 As for question 2: when can we tell whether or not a draft class is good or not? The answer is a little more complicated. Plot 2 shows that there are some win share discrepancies show up as early as year one. However, you do see some shuffling as years go on. For example, the 2008 draft started out really hot (Derrick Rose, anyone?), the most win shares produced in years 1 and 2, but kind of leveled off after that (Derrick Rose, anyone?). In contrast, the 2011 draft started out slow (Lockout, anyone?), but produced the most single season win shares by a draft class in year 4. The curve in Plot 2 shows that draft classes reach peak production around years 4 and 5, which is probably the best time to evaluate the goodness and badness of the draft class. It can be tempting to try to evaluate after year 1, but there are many instances of draft classes making up ground. Plots 3 and 4 show this. The 2006 draft produced 7 more win shares than the 2007 draft class in year 1, but by year 5, the 2007 draft class had produced almost 70 more win shares. One might be tempted to look at the 2014 class and say they are doomed, but remember Jabari Parker, Joel Embiid, and Julius Randle all missed pretty much the whole season, and in the long run, the win shares produced by those players could make up some serious ground.
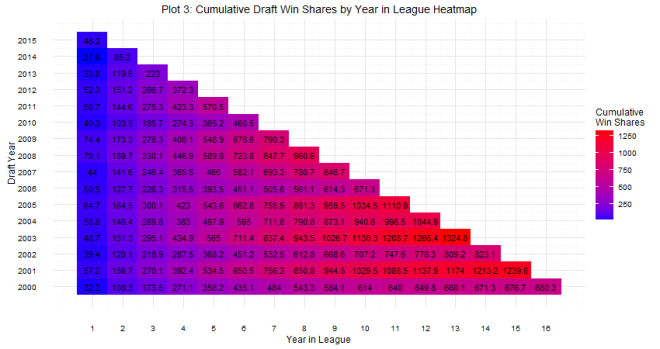
While there is some important sorting that goes on in years 4 and 5, I think one has to wait even longer to get a more concise evaluation. Plot 4 shows that some differentiation occurs later down the road. Right now, the 2011 draft is in a dead heat with the 2003 draft for best draft class. We won’t know which is better until some more careers have taken shape. How is KD going to affect Klay Thompson? Does Kawhi take another step with Duncan retiring? We won’t have a definitive answer of which draft was better until these and other questions play out, which will take years.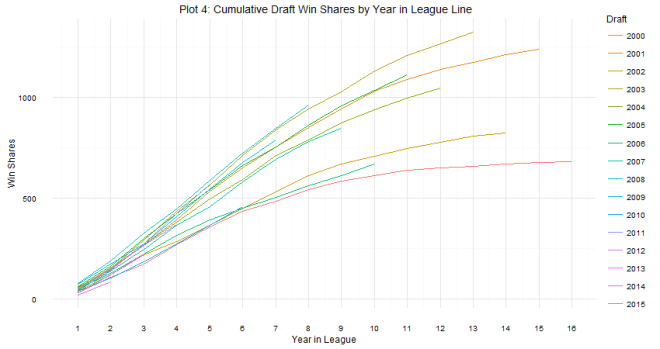
Overall, using cohort analysis and some simple visualizations, I showed that there are good and bad drafts, the difference between the two is substantial, and that evaluating draft classes takes at least 4 years, and probably longer if you want to be more concise. While this has been a good learning experience, it’s led me to ask a lot more questions, the answers to which will hopefully come soon! Thanks for reading!
Data from Basketball Reference
Code at my Github

[…] Miles blog post on Using Cohort Analysis T Measure NBA Draft Value. Nylon Calculus writes that Pachulia’s Rebounding not enough for Warriors post-Durant […]
LikeLike