Hi All,
Sorry it’s been so long since I’ve posted; life has been a little crazy in the Miles household! (More on that here).
Alex Bresler just created a wrapper for the new Forbes API (see his blog post here). I was playing around with it and found that there’s a lot of good data there! I thought I’d share an example of how you can use this wrapper in conjunction with Ari Lamstein’s choroplethr package to map some of this data. I chose to plot the Forbes list ‘Best Cities for Business’ by state, but between these packages, there are so many options!
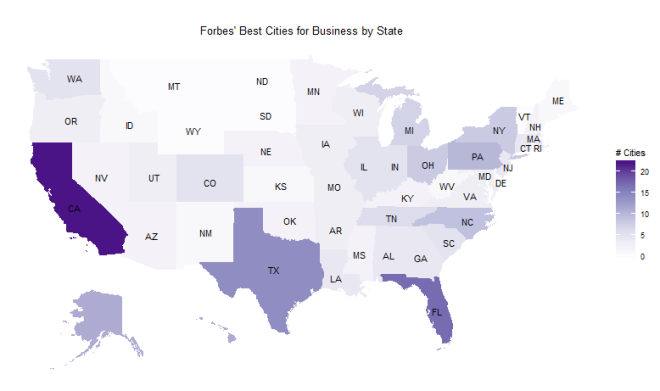
For the most part, this echoes a population map (an issue with many national maps). California, Texas, and Florida are the clear leaders here. Let’s look at the same map from a per-capita perspective to control for state populations.
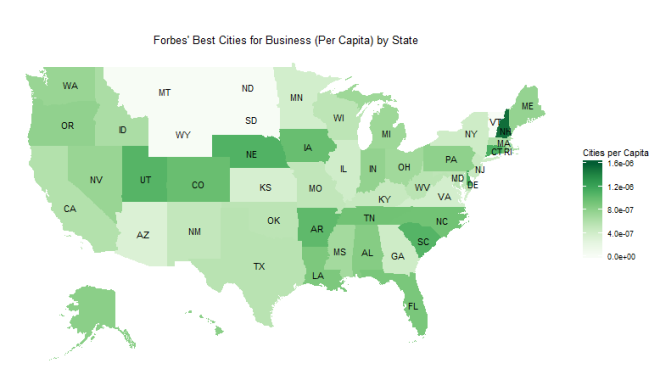
In this plot, New Hampshire, the Mountain West/High Plains and the South start to look a lot better than they did on the previous plot. I wouldn’t pretend to know what exactly this information means in terms of state policy toward business, but these easy visualizations make it a lot easier to get the right information!
Most importantly, I think these packages and examples illustrate why the R community is so great. I don’t really know much about web scraping, or mapmaking, but these packages make it muuuuch easier to access and visualize data from various sources. Blog posts that contain code (like Julia Silge’s here) provide awesome examples and templates. The R community is seriously awesome.
Code posted at my github
