Intro
2017 is going to start off with a pop culture bang. No, I’m not talking about the Inaugurtation (it’s not pop culture if no celebrities are there, right?), the CFP Final, or even the NFL playoffs. I’m talking about the Bachelor, of course Since 2002, we’ve watched reality TV’s finest compete for love and the opportunity to break off an engagement with that special someone 6 months later.
Why, you ask, would this matter for a data science blog? Inspired by Alice Zhao’s analysis, I wanted to look at how the numbers for this season compared to others as well as predict some of the season’s outcomes so I can win my office fantasy league! While, it turns out, there are a lot of blogs and resources devoted to examining data within sports, pop culture, politics, society, and many other things, there is not a lot of data science devoted to understanding and predicting the Bachelor! I, as a citizen data scientist, could not let this stand.
Methodology – What did I do?
I scraped data from the Wikipedia pages for as many seasons of the Bachelor as had pages. These tables had age, hometown, and occupational information about bachelors as well as contestants. From this info I calculated age differences and hometown distances between contestants and bachelors. All of this was thrown into a model to estimate the probability of each contestant getting a hometown date, and getting the final rose. I left out seasons 9 and 12 from the analysis (seasons with an Italian and English bachelor), as the distance variables are fundamentally different for those seasons.
Descriptives
Age
Nick’s age has been a source of controversy heading into this season. Both Chad and Robby had things to say about it. But how does Nick’s age actuallly compare to those of previous Bachelors?
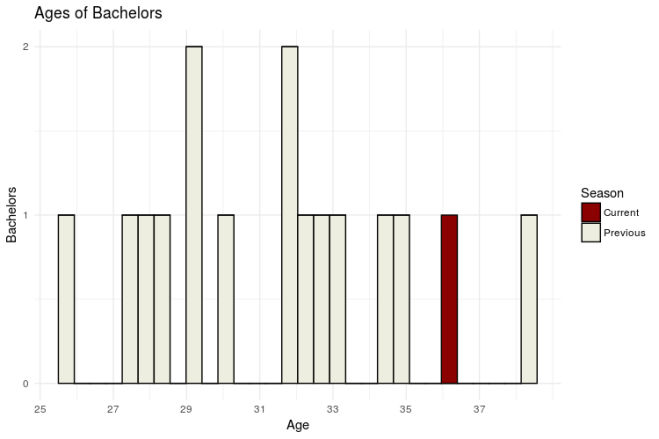
Surprisingly, Nick, at 36, is not the oldest! That honor goes to Brad Womack, who was 38 during his second go round. Hey, if it works for Brad*, it can work for Nick, right? Right? …
Anyway, lets take a look at how the age distribution of current contestants compares to that of previous seasons.
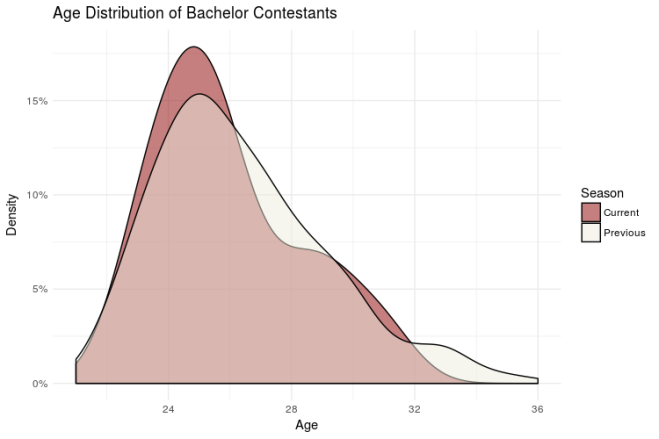
Interestingly, the age distribution for this season isn’t much different than that of previous seasons. If anything, it skews a little younger. That should make for an interesting dynamic this season! (We’ll see if the old “Hi, I’m Nick and I was likely in Middle or High School when you were born, isn’t that crazy?!” pick up line works).
Occupations
To categorize contestant occupations, I created a series of dummy variables for common contestant occupations (manager, nurse, sales, student, etc.). The following graph compares the number of contestants within each occupation this season with the average number of contestants in each occupation for all previous season.
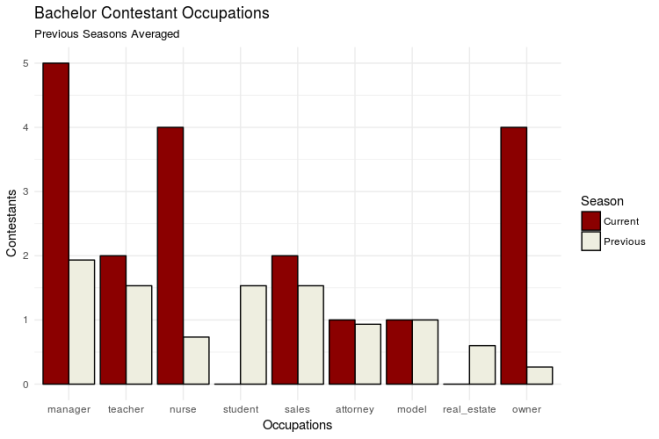
We have some BOSS ladies this season! The categories that stand out most are Manager, Nurse, and Owner. I’m so looking forward to the squabbles about whose business is bigger (detailed under the ‘Sickest Burns’ section here)
Geography
Where are contestants from this year? Let’s map it out and see. Note: This map obviously leaves out some contestants from previous years. For the sake of this analysis, I just wanted to focus on the continental US in order to more easily spot any variation
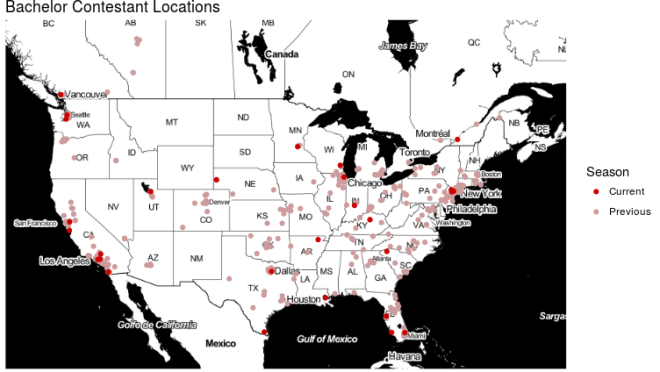
Overall, it doesn’t seem like there are any substantial breaks from previous seasons. Geographically, the Bachelor is an equal opportunity show! But how far away are this season’s contestants compared to previous seasons? Will they have to overcome quirky regional quirks moreso or less than we’ve seen in the past?
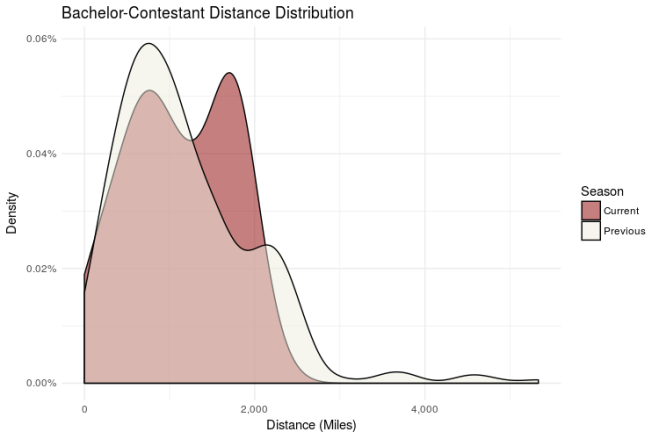
The bimodal distribution here is interesting. Nick’s got a larger proportion of contestants from ~2,000 miles from his hometown (Milwaukee, Wisconsin). From this and the map above, it looks like there are two distinct groups here: Middle America (mode 1), and Everyone else (mode 2). Something to keep an eye on as the season goes on.
Model Prediction (Come on, Aaron, who’s gonna win!?)
To predict final rose and hometown date probability, I trained a model on all available previous seasons using contestant age, age difference to bachelor, occupation (a series of dummy variables), contestant geographic region (based on a clusting of hometown locations), and distance between contestant and bachelor hometowns as the varaibles in my model. It turns out these variables aren’t SUPER predictive of getting a final rose or a hometown date (~.57 AUC for final rose and ~.50 AUC for hometown date for reference, a model with a .50 AUC score performs about as well as just randomly guessing), so don’t go betting your house on the results here. Shocker, I know. With that said, let’s take a look at the maybe-slightly-better-than-random-guessing output!
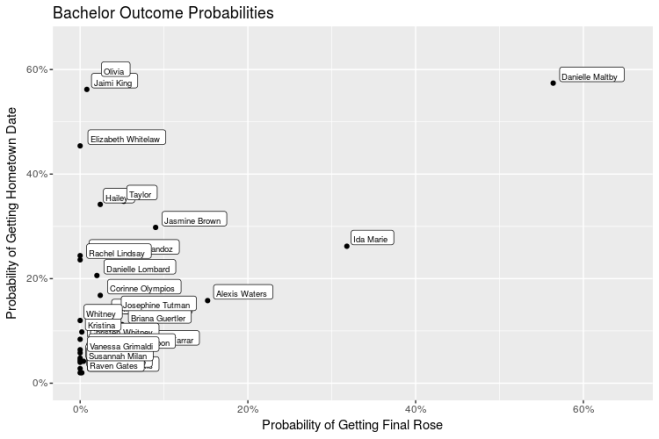
The clear favorite hear seems to be Danielle Maltby. What is likely driving this is that she is 31 (small age difference from Nick), originally from Wisconsin (though her ABC bio says Nashville), and she’s a Nurse. The pretenders look to be Olivia, Jaimi King, and Elizabeth Whitelaw; these three have high hometown date probabilities, but substantially lower final rose probabilities. Ida Marie is a bit of a sleeper, with the second highest final rose probability, but middle of the road hometown date probabilities. (Let’s hope her literary humility helps separate her from the pack!)
Conclusion
Danielle M is our girl! Now that data justice has been served to the Bachelor. This was my first interation of the model and, as I’m sure results Monday will show, there’s a lot of room for improvement. There definitely need to be more features added (likely extracted from Bio text or something along those lines) and hopefully I’ll be able to get that up before the Bachelorette later this year. If I could get my hands on the data, it would also be a lot of fun to calculate in-season win probabilities (e.g. Oooh, Danielle L., got put on the week 3 group date, that incrases her chance of winning by 4% pts!). If we wanted to be extra judgy, I could also build a model that predicts a successful marriage and we could contrast that with final rose probability (JoJo would have had a higher chance at a successful marriage with Luke and we all know it!).
Anyway, this was a ton of fun, and I’m hoping to continually track how wrong I am throughout the season!
*It didn’t work for Brad
Code at my Github
This is outstanding! LOL! I usually do a spreadsheet.. listing the order of the roses and then the average the numbers to an “average rose number.” I usually can predict the winner after about week 5-6! They usually give roses in order of preference. It’s totally ridiculous – but fun.
LikeLike